Whole Slide Image export
There are videos detailing the whole slide image export process from start to finish at the end of this page. Below is a breakdown of each panel and button used in the examples.
Tissue export window
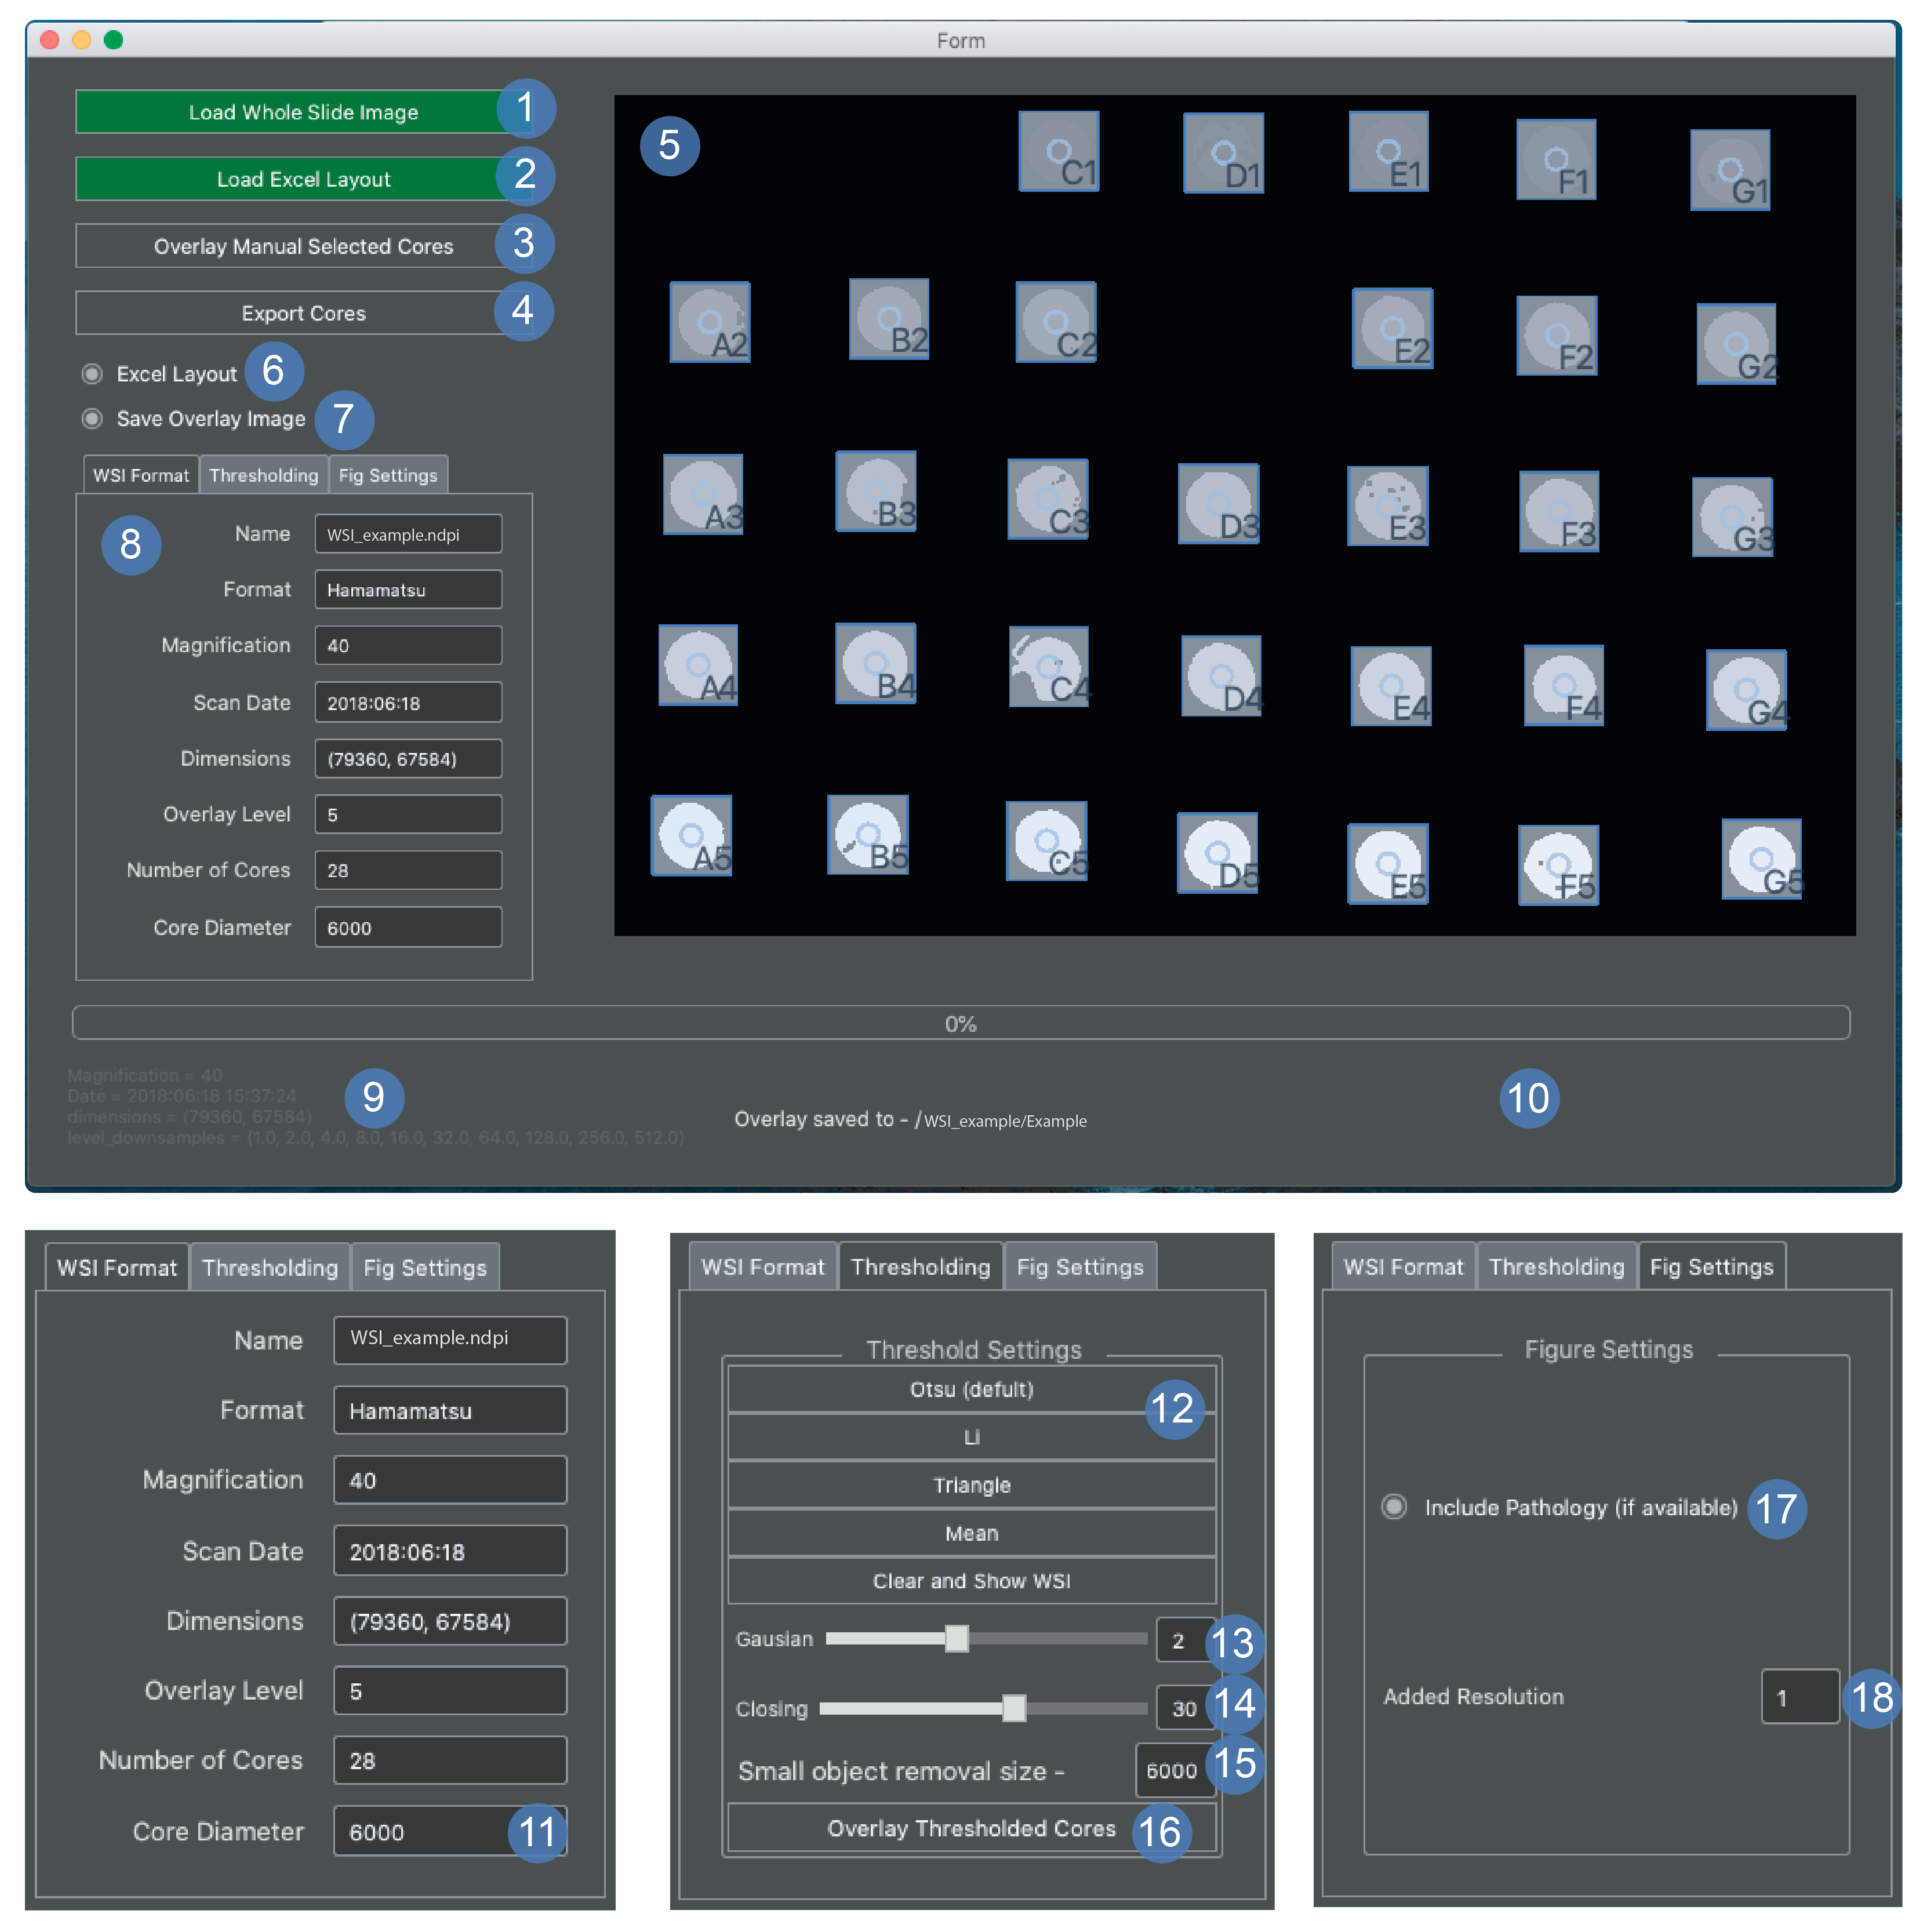
The tissue export window is for exporting png images from whole slide files using a map of the array that is provided by the user - see array map example.
- Load WSI prompts a dialog box for the user to select a NDPI or SVS file.
- Load Excel this is a prompt to load the excel map.
- If the excel is named the same as the array and in the same directory,it will be loaded automatically. Otherwise this button can be used to load a different location.
- If this has happened then the button will turn green.
- This can also be used to reload the excel map at any point if the map has been changed by the user.
- Overlay of manually selected cores.
- This is applied after a user selection has been applied in panel number 5.
- It can also be used after the cores have been moved to update the window.
- Export cores should only be executed the user is satisfied that the cores are in the correct configuration.
- Export core command will disable user input and export the core png images to the WSI directory.
- Display window.
- Double click to add core.
- Spacebar to remove last point.
- You can drag pre-applied cores before or after applying the bounding boxes.
- Excel layout the recommended way to index cores is with the row names as the number and the column names as the letter (A6 col A row 6) if you want to reverse this (A6 row A col 6) then uncheck the box when the window opens.
- Save overlay image determines whether or not to automatically save the image in the viewer (5).
- Tab viewer window is further explained in points 11-18.
- Image metadata for the WSI file.
- Progress update panel is where progress updates will appear.
- Core diameter is currently set to 6000 pixels which is similar bounding box size as a 1mm diameter tissue core.
- This value can be chosen before image export and you can see what the new selection looks like by selecting the overlay cores button (3).
- Thresholding options.
- Choose the best threshold then proceed to 13.
- Gaussian blur shows the sigma value applied to the gaussian which must be applied after 12.
- Closing should be applied after 13 and stands for binary morphological closing.
- higher slider values will lead to a more closed mask.
- Removal of small objects from the mask gives the value of the minimum size to be removed.
- If you have very small tissue cores then this will need to be reduced.
- This applies the changes added in steps 12-15 and overlays the core images and labels.
- These are the settings for the first figure that is exported.
- This option will add a bounding box to the figure to denote the pathology of the core as either red or green.
- This will only work if the first tab of the xlsx file with the array contains a map indexed with N and T for normal and tumour, respectively.
- Please see the array map example for more indexing pathology details.
- If you increase this number, then it will increase the level that the images are taken from in the WSI.
- Increasing this will exponentially slow the program down so use sparingly.